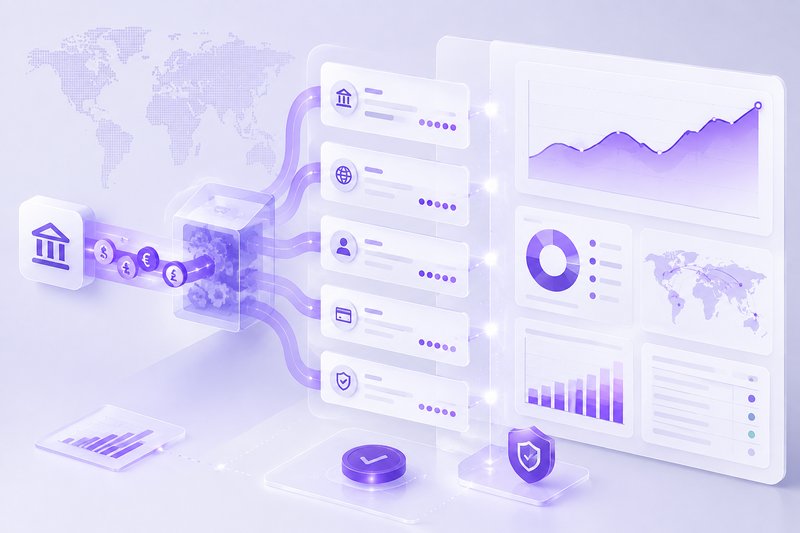
Quick Answer: Why B2B Payment Analytics Matter More Than Ever in 2026
Every cross-border payment generates data — but for most finance teams, that data disappears into bank statements, processor reports, and ERP ledgers without being turned into actionable intelligence. B2B payment analytics is the practice of systematically collecting, analyzing, and acting on payment transaction data to reduce costs, improve cash flow, detect anomalies, and make smarter decisions about payment rails, providers, and terms.
In 2026, payment analytics has moved from "nice to have" to competitive necessity. Companies with mature payment analytics programs save 15–30% on cross-border payment costs through better FX routing, provider optimization, and fee transparency — while also detecting payment fraud and processing failures weeks earlier than peers relying on manual reconciliation. This guide covers the KPIs that matter, how to build a payment data infrastructure, and the analytics playbook that turns transaction data into a cost-optimization engine.
The Payment Data Problem: Why Most Finance Teams Fly Blind
To understand why payment analytics is so important, you first need to understand why most companies are flying blind:
Data Fragmentation. A typical mid-market company processes payments through 2–5 providers (primary bank, FX broker, payment platform, card processor, payroll provider). Each generates reports in different formats, at different cadences, with different field definitions. Reconciling "amount sent" from one provider with "amount received" from another is manual work — and the data often doesn't match.
Hidden Costs. The headline fee (0.5% FX markup, $15 wire fee) is only part of the picture. Beneficiary bank deductions, intermediary bank fees, FX spread widening on specific currency pairs, and batch processing surcharges often add 1–3% to the real cost of a cross-border payment — but these costs aren't line items on any single report. Payment analytics reveals them.
Latency Blindness. Finance teams know when a payment is "sent" and when it "arrives" — but the time between those two events is a black box. Is a specific currency corridor consistently slower? Does a particular beneficiary bank hold funds for 2 extra days? Without analytics, these patterns are invisible — and they directly impact supplier relationships and working capital.
No Comparative Context. Knowing you paid 1.2% in FX spread on your last EUR payment is meaningless without context. Is the market rate 0.3%? Are your peers paying 0.8%? Payment analytics provides the benchmarking and trend data that transforms fees from "the cost of doing business" into a trackable, optimizable variable.
The 7 Essential B2B Payment Analytics KPIs
Don't try to measure everything. Start with these seven metrics — they cover the 80% of payment value that most finance teams miss:
| KPI | What It Measures | Why It Matters |
|---|---|---|
| Total Cost of Payment (TCP) | All-in cost: provider fee + FX spread + intermediary fees + beneficiary deductions ÷ payment amount | Headline fees are misleading. TCP reveals true cost per corridor. |
| FX Spread vs Market | (Your effective rate − mid-market rate at execution time) × payment amount | The largest hidden cost in cross-border payments. Should trend downward over time. |
| Payment Success Rate | Payments completed without manual intervention ÷ total payments initiated | Below 95% indicates provider, data quality, or compliance issues. |
| End-to-End Settlement Time | Time from payment initiation to confirmed credit in beneficiary account | Varies wildly by corridor. Impact on supplier terms and early-payment discounts. |
| Cost Per Currency Pair | TCP broken down by currency corridor (USD→EUR, USD→INR, etc.) | Reveals corridors where you're overpaying. Drives provider/routing decisions. |
| Payment Exception Rate | Payments requiring investigation, repair, or resubmission ÷ total payments | Each exception costs $25–$75 in ops time. Signals data quality or provider issues. |
| Provider Concentration Risk | Percentage of payment volume routed through a single provider | Concentration above 70% creates fee-negotiation weakness and outage risk. |
Pro tip: Don't build these KPIs in Excel. By month 3, the spreadsheet will break, formulas will be wrong, and nobody will trust the numbers. Invest in a payment analytics tool or build a data pipeline from day one.
Building a Payment Analytics Infrastructure: Where Data Lives
The hardest part of payment analytics isn't the analysis — it's getting clean, unified data. Here's where payment data is hiding in most organizations:
1. Payment Provider APIs and Portals. Your payment platform, FX broker, and card processor all expose transaction data — but rarely in a format that's easy to consolidate. Modern platforms (Stripe, Adyen, Wise Platform) offer API-first data access with webhook-based event streaming. Legacy providers may require CSV downloads from a portal. The gap between these is where analytics efforts stall.
2. Bank Statements and MT940/MT942 Files. For SWIFT-based corporate payments, the bank statement is often the most reliable source of truth for what actually arrived — not what was "sent." MT940 (intraday statement) and MT942 (interim transaction report) formats contain detailed settlement data including intermediary bank deductions that don't appear on provider reports.
3. ERP Payment Modules. SAP, NetSuite, and Microsoft Dynamics maintain payment transaction records — but they're designed for accounting, not analytics. The payment object in your ERP typically stores the invoice amount, payment amount, and date — not the FX rate applied, intermediary fees, or exact settlement timestamp. You'll need to enrich ERP data with provider data.
4. Treasury Management Systems (TMS). If your organization uses a TMS (Kyriba, GTreasury, FIS), it likely already has some payment analytics capabilities — but they're often limited to bank-connected payments and may not include fintech payment platforms or card programs.
Cost Attribution: The Framework That Makes Hidden Fees Visible
Cost attribution is the analytical practice that makes payment analytics actionable. Instead of just seeing "we spent $48,000 on payment fees last quarter," cost attribution shows you why — by corridor, by provider, by payment method, and by transaction type.
Step 1: Map Every Fee to a Cost Category. Classify every payment cost into one of four buckets:
- Provider fees: Per-transaction fees, monthly platform fees, setup fees
- FX costs: The spread between your rate and the mid-market rate at execution
- Intermediary/beneficiary costs: Correspondent bank deductions, receiving bank fees
- Operational costs: Finance team time spent on exceptions, investigations, manual processes
Step 2: Tag Every Transaction with Dimensions. For each payment, track: currency pair, payment method (SWIFT, local rail, card, stablecoin), provider, amount band ($0–5K, $5K–50K, $50K+), beneficiary country, and whether it's a recurring or one-time payment. These dimensions enable cost comparison across corridors.
Step 3: Calculate TCP (Total Cost of Payment) by Dimension. Your goal: "Sending USD→EUR via Provider A on SWIFT for amounts $5K–50K costs an average of 1.8% TCP." Now compare that to Provider B, to local rails, and to the previous quarter. This is the insight that drives provider negotiations and routing decisions.
Step 4: Set Thresholds and Alerts. Once you have baseline TCP by corridor, set alerts: if any corridor's TCP exceeds baseline by 20% in a given week, investigate. This catches intermediary bank fee changes, currency volatility spikes, and provider pricing changes that would otherwise go unnoticed for months.
Anomaly Detection: Using Payment Data for Fraud and Error Prevention
Payment analytics isn't just about cost — it's about security. Transaction-level payment data contains signals that can detect fraud, errors, and process failures before they cause financial damage:
Duplicate Payment Detection. Same amount, same beneficiary, within 48 hours? Flag for review. Payment analytics platforms can automate this — but even a weekly Python script comparing transaction records from your ERP against provider reports catches duplicates that manual reconciliation misses.
Beneficiary Account Changes. Payment going to a beneficiary you've paid before — but with different bank account details? This is the #1 vector for business payment fraud (vendor impersonation). Payment analytics should flag any beneficiary account detail change and require verification before processing.
Amount Deviation from Historical Patterns. If you typically pay Supplier X between $8,000 and $12,000 per month, a $47,000 payment to Supplier X should trigger review — even if it's within approval limits. This catches both errors (wrong amount entered) and fraud (compromised invoice).
New Corridor Anomalies. First time sending to a particular country or using a particular currency? Flag it. New payment corridors are where compliance and fraud risk is highest. Analytics should treat "first time to this jurisdiction" as a dimension that triggers enhanced review.
Settlement Time Drift. If USD→BRL payments typically settle in 2 days and suddenly start taking 5 days, something changed — an intermediary bank issue, a compliance hold, a provider routing change. Catching settlement time drift early prevents supplier relationship damage.
The Payment Analytics Dashboard: What to Actually Track
A dashboard that nobody looks at is worse than no dashboard at all. Build yours around three views, each designed for a specific audience:
View 1: Executive Summary (CFO/Head of Finance). Top-line metrics updated monthly: total payment volume processed, total cost of payments (TCP%), TCP trend (up/down vs last quarter), provider concentration percentage, and biggest cost-saving opportunity identified. One screen, five numbers. If the CFO needs to scroll, the dashboard has failed.
View 2: Operations Dashboard (AP/AR Team). Daily operational metrics: payment success rate, exception count by type, pending payments older than SLA, settlement time by corridor. Designed to be checked in the first 5 minutes of the day — what broke overnight that needs attention today?
View 3: Cost Optimization (Treasury/Finance Analyst). Quarterly deep-dive view: TCP by currency corridor and provider, FX spread comparison (your rate vs market, by week), provider cost ranking, volume-weighted average cost. This is where the money is saved — and where you build the business case for switching providers or changing routing logic.
3 Real-World Payment Analytics Wins
Win 1: The Intermediary Bank Deduction Discovery. A mid-market importer analyzed their USD→CNY payment data and discovered that one particular intermediary bank was deducting $25–$75 from every payment — costs that never appeared on their primary provider's reports. Just the TCP data from the CNY beneficiary's bank statements revealed the deductions. Switching to a provider with a direct CNY rail saved them $18,000/year.
Win 2: The FX Spread Wake-Up Call. A SaaS company paying international contractors in 12 currencies assumed their payment platform's "0.5% FX fee" was competitive. Payment analytics revealed their effective FX spread was actually 1.8% — the platform was marking up the mid-market rate before applying the "0.5% fee." By adding a second provider for high-volume currency pairs, they cut FX costs by 40%.
Win 3: The Duplicate Payment Catch. A procurement team at a manufacturing company ran a simple analytics script comparing their ERP payment records against bank statements and found three duplicate payments totaling $47,000 in the previous quarter — errors that manual three-way matching had missed because the duplicate amounts were split across different invoice numbers.
Common Mistakes in B2B Payment Analytics
Mistake 1: Starting with a dashboard instead of a question. The most common failure mode: "Let's build a payment analytics dashboard." Six months later, there's a beautiful Grafana dashboard showing 47 metrics that nobody uses. Instead, start with a specific question: "What's our true cost of sending USD→EUR payments?" Answer that question with data, then build from there.
Mistake 2: Trusting headline fees. "Our provider charges 0.5%." No, they don't — not if you measure TCP (total cost of payment) from the amount you send to the amount the beneficiary receives. FX spreads, intermediary deductions, and batch-processing markups push real costs 2–4× above headline rates. The benchmark that matters is TCP%, not the advertised rate.
Mistake 3: Analyzing cost but ignoring speed. A provider with 0.3% TCP but 7-day settlement time may cost more in real terms than a 1.0% provider with next-day settlement — especially if you offer early-payment discounts or have suppliers with strict payment terms. Payment analytics must consider the cost-of-speed tradeoff.
Mistake 4: Building analytics in Excel. Excel is a prototyping tool, not an analytics infrastructure. By the time you're importing from 3+ data sources, Excel becomes fragile, error-prone, and impossible to audit. Move to a database (even SQLite) and a BI tool (Metabase, Looker, Power BI) before your spreadsheet becomes a liability.
Mistake 5: Never closing the loop. The purpose of payment analytics is to drive decisions. If you discover that Provider B is 30% cheaper than Provider A for USD→MXN payments, but nobody adjusts the routing rules or renegotiates Provider A's pricing, the analytics exercise was academic. Every insight should have an owner and a deadline for action.
Frequently Asked Questions
What's the minimum number of payments needed to make analytics worthwhile?
If you process fewer than 50 cross-border payments per month, the cost variance is probably too small to justify building dedicated analytics infrastructure. Focus on a quarterly manual review: pull all payment data, calculate TCP for your top 3 corridors, and check for obvious overcharging. For 50–500 payments/month, a lightweight analytics setup (database + BI tool) pays for itself within 3–6 months. Above 500 payments/month, payment analytics is non-negotiable — the cost savings alone typically justify a full-time finance analyst.
How do I get FX mid-market rates for historical comparison?
Several sources provide historical mid-market rates: the European Central Bank (free, daily rates for major currencies), Open Exchange Rates (API with free tier), and most FX data providers (OANDA, XE). For accurate TCP calculation, you need the mid-market rate at the time of payment execution — not the daily average. If your payment provider doesn't timestamp transactions, use the rate at the nearest 5-minute interval from an API provider.
Can my existing ERP handle payment analytics?
Probably not — at least not well. ERPs are designed for general ledger accuracy, not payment cost analysis. They typically record the payment amount in your base currency after conversion, which obscures the FX rate applied and doesn't capture intermediary deductions. You'll need to enrich ERP payment data with provider transaction data, bank statement data, and FX reference rates. Some modern ERPs (NetSuite, Sage Intacct) have better payment analytics modules, but they're rarely as detailed as a dedicated approach.
Should I build or buy payment analytics?
For most mid-market companies: buy. Payment analytics platforms (Verto, Tipalti, Airwallex analytics modules) and general BI tools (Metabase, Looker) connected to payment provider APIs cover 90% of use cases at a fraction of the cost of building from scratch. Build only if you have: very high payment volume ($50M+/year), unique reporting requirements that off-the-shelf tools can't handle, or an existing data engineering team. Even then, start with a provider's built-in analytics module and extend from there.